Call Stats & Analytics
The Call Stats module provides detailed analytics about your call center operations. Monitor call volumes, agent performance, missed calls, and trends — all in real time.
Call Stats Dashboard
Go to Call Stats in the Super Dashboard sidebar. The dashboard shows:
Call Statistics
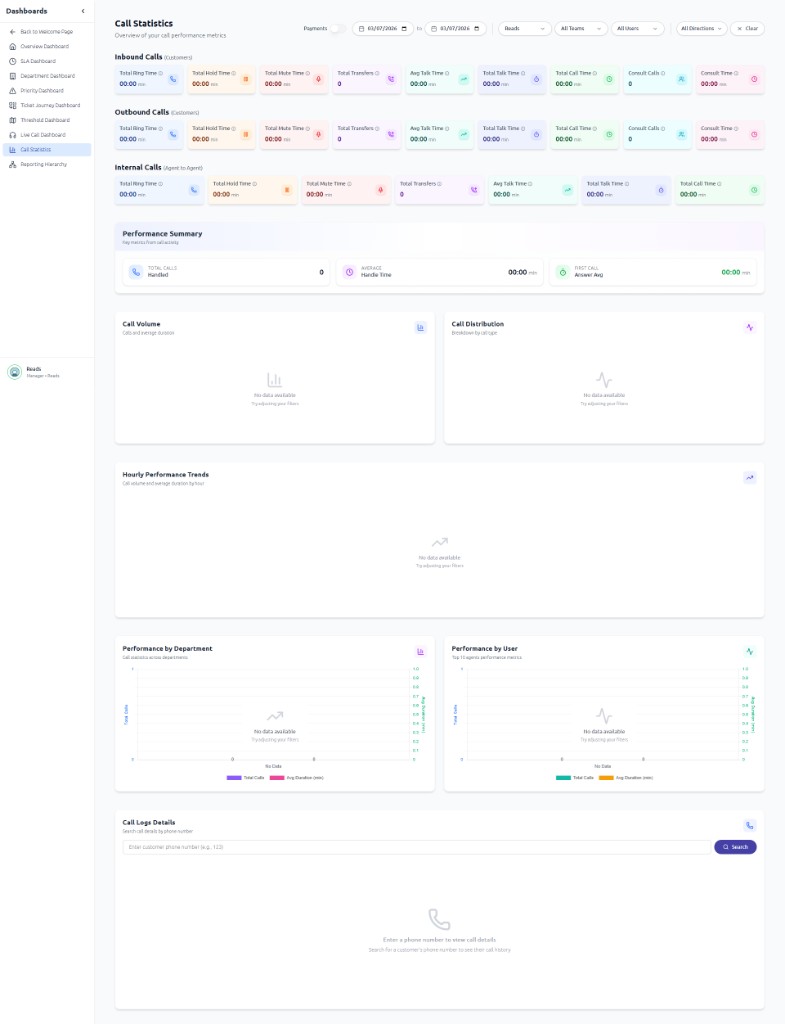
Key Metrics
| Metric | What It Shows |
|---|---|
| Total Calls | Total number of calls in the selected period |
| Incoming Calls | Number of inbound calls received |
| Outgoing Calls | Number of outbound calls made |
| Missed Calls | Calls that were not answered |
| Average Duration | Average call length |
| Average Hold Time | Average time callers spent on hold |
| Average Talk Time | Average time spent talking |
Agent Performance
View how each agent is performing:
- Calls handled — How many calls each agent took
- Average handling time — How long each agent spends per call
- Missed calls — How many calls each agent missed
- Active agents — Who is currently available and taking calls
Trends & Reports
The trends section shows call patterns over time with interactive charts:
- Call volume by hour — See peak hours for staffing decisions
- Call volume by day/week — Identify busy days
- Performance over time — Track improvements or issues
Call History
View detailed call logs including:
- Caller phone number
- Agent who handled the call
- Call duration, hold time, talk time
- Call direction (incoming/outgoing)
- Call outcome
- Number of transfers
Missed Calls
The missed calls view shows all unanswered calls. Use this to follow up with callers who could not reach an agent. You can see the caller's phone number and the time of the missed call.
Analytics Dashboards
In addition to Call Statistics, NextGen provides several analytics dashboards accessible from the Dashboards section. These are part of the Super Dashboard analytics:
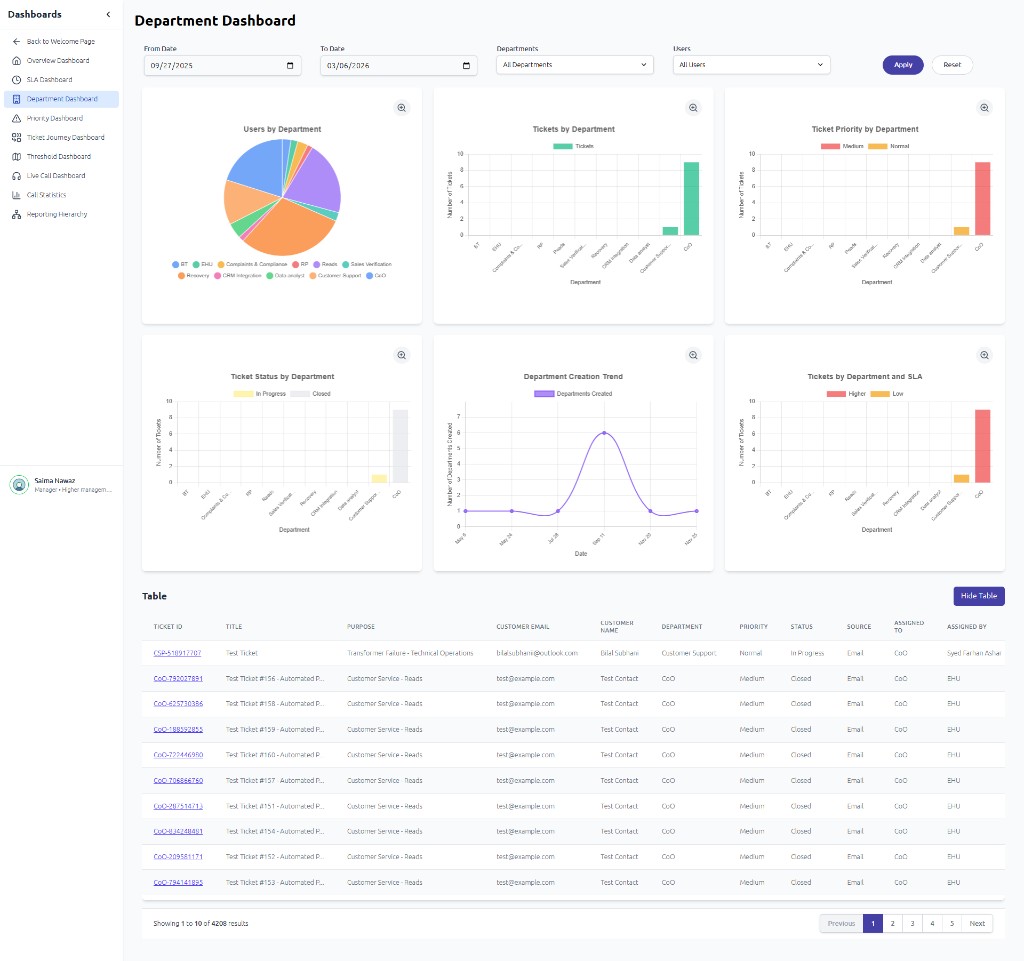
Department Dashboard
The Department Dashboard shows users and tickets by department with charts and a detailed table:
Other Analytics Dashboards
| Dashboard | What It Shows |
|---|---|
| Overview Dashboard | Total tickets, KPIs, efficiency metrics; charts by SLA, priority, department, manager |
| SLA Dashboard | SLA breach rate, tickets by SLA priority, breach by department, resolution trends |
| Department Dashboard | Users and tickets by department; priority/status breakdown; creation trends |
| Priority Dashboard | Ticket distribution by priority; SLA breach by priority |
| Ticket Journey Dashboard | Sankey flow of tickets through statuses (New → Assigned → In Progress → Resolved → Closed) |
| Threshold Dashboard | Department/manager workload vs threshold |
| Live Call Dashboard | Real-time agent status (available, on call, on hold, mute, break) |
| Call Statistics | Inbound/outbound/internal metrics; performance by department/user |